
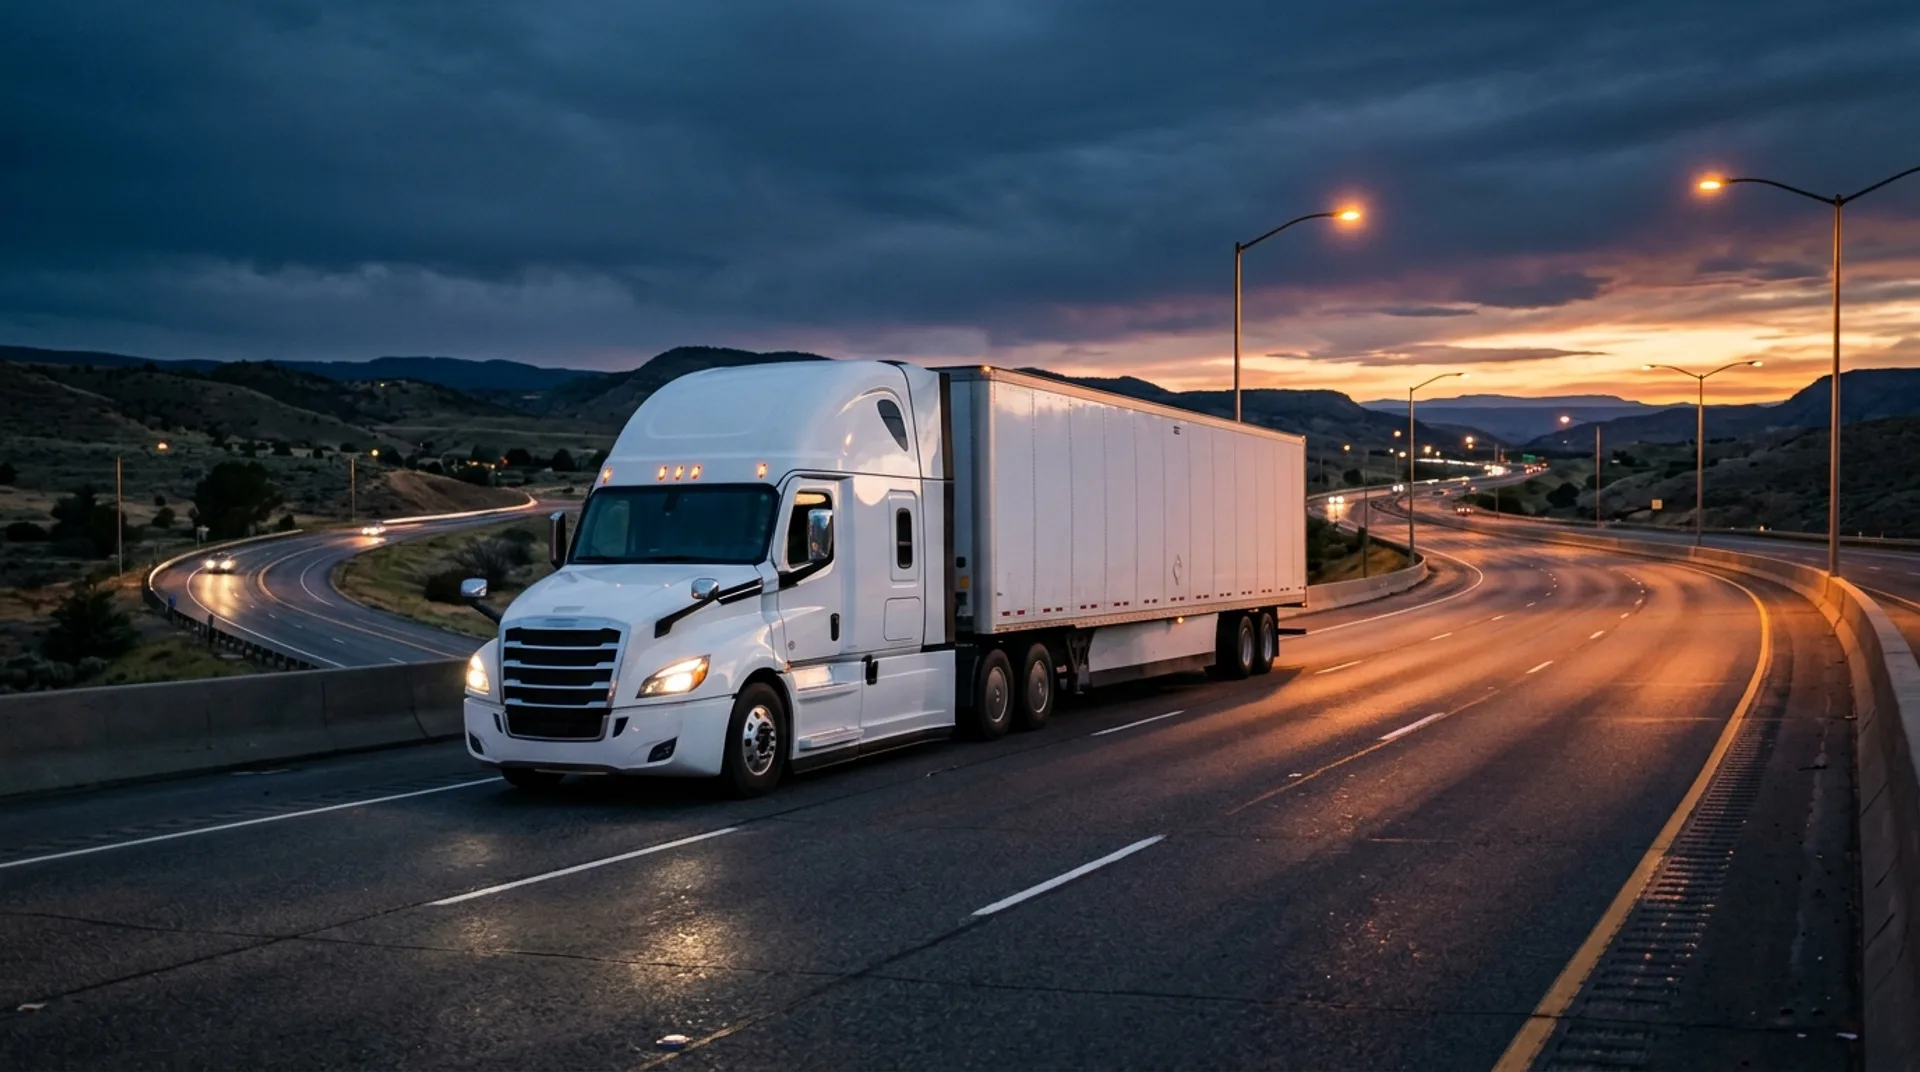
Trucking cost per mile is total monthly operating expenses divided by miles. In 2026, healthy U.S. owner-operator CPM is $1.85–$2.10 all-in. Booking floor is CPM + $0.40/mi profit. Use the calculator above and adjust for deadhead — empty miles inflate your effective CPM.
Industry rate benchmarks and cost analysis from the Bonafide dispatch desk.
What is cost per mile in trucking?
▼
Cost per mile (CPM) is the operating cost of running one mile with your truck. It's the single number that turns a full monthly P&L into something you can hold up against a broker's rate confirmation in ten seconds. If the load pays less than your CPM, you lose money. If it pays your CPM plus at least $0.40/mi, you clear real profit.
How to calculate your trucking cost per mile (step-by-step)
▼
The quick method (P&L ÷ miles)
Add every dollar the truck cost you last month — truck note, insurance, fuel, driver pay or owner draw, maintenance reserve, dispatch, factoring, permits, ELD, personal draw — and divide by the miles your ELD shows. Fast, honest, works.
The itemized method (category-by-category)
Bucket every cost into fixed (doesn't change with miles) or variable (scales with miles), then compute a per-mile figure for each. Slower, but it tells you which lever moves margin the most and lets you model rate scenarios.
Fixed costs vs. variable costs — why the difference matters
Fixed costs bill whether the truck moves or not — truck/trailer payment, insurance, IRP, ELD subscription, health insurance. More miles = lower fixed CPM. Variable costs scale with miles — fuel, maintenance, tolls, driver pay per mile, dispatch and factoring percentages. That's why parked trucks and heavy deadhead destroy margin: fixed keeps billing while revenue stops.
Average cost per mile by truck type (2026 data)
▼
| Equipment | 2026 CPM range | Typical booking floor |
|---|---|---|
| Dry Van | $1.85 – $2.05 | $2.55/mi |
| Reefer | $2.00 – $2.25 | $2.85/mi |
| Flatbed | $1.95 – $2.20 | $2.90/mi |
| Tanker | $2.10 – $2.40 | $3.15/mi |
Sources: ATRI 2024 Operational Costs of Trucking ($2.270/mile average marginal cost), DAT/FreightWaves 2025 owner-operator surveys, and ATBS 2024 benchmark data, projected on 2026 diesel and insurance conditions.
Owner-operator vs. company driver CPM
A company driver's seat costs the carrier roughly $0.85 – $1.10/mi (pay, benefits, hiring, insurance). An owner-operator eats the full $1.85 – $2.40/mi because they carry every fixed cost themselves. The tradeoff is control: your freight, your rate floor, your take-home.
How deadhead miles affect your real cost per mile
▼
Deadhead miles carry your full fixed cost with zero revenue on them. If you show a $1.85/mi CPM on total miles but run 15% deadhead, your effective cost per loaded mile is $2.18. That's the number to compare against a broker's rate — not the raw CPM. The calculator above does this conversion automatically. Top dispatched fleets hold deadhead under 8%; a good dispatcher books your reload before you deliver, cutting empty miles 30–50%.
How to use cost per mile to set your rate (and negotiate with brokers)
▼
Your rate floor is effective CPM + $0.40/mi as an absolute minimum. Healthy target is CPM ÷ (1 − 0.30) which gives you a 30% margin. When a broker offers below your floor, you have three moves: counter with your floor, ask for a fuel-surcharge boost equal to the gap, or pass. Never explain your cost math on the phone — the number you name is the number, not a starting bid.
Real example: 3-month cost-per-mile breakdown from an active reefer owner-operator
▼
| Category | Monthly avg | $/mile |
|---|---|---|
| Driver pay / owner draw | $6,175 | $0.65 |
| Fuel (6.2 MPG @ $3.85) | $5,900 | $0.62 |
| Truck + trailer payment | $3,050 | $0.32 |
| Insurance (PD, liability, occ/acc) | $1,990 | $0.21 |
| Maintenance reserve | $2,280 | $0.24 |
| Dispatch (7% of $27.1k gross) | $1,897 | $0.20 |
| Factoring (2.5% of $27.1k gross) | $678 | $0.07 |
| IRP, permits, ELD, subs | $410 | $0.04 |
| Tolls & misc | $210 | $0.02 |
| Total effective CPM (9,500 loaded miles) | $22,590 | $2.37 |
Takeaway: This operator's rate floor is $2.77/mi (CPM + $0.40) and 30%-margin target is $3.39/mi. Any reefer load below $2.77 is refused; anything at or above $3.39 is booked immediately.
Common mistakes when calculating cost per mile
▼
- Excluding driver pay / owner draw — inflates margin, leads to booking money-losing loads.
- Using sticker MPG instead of the ELD's real MPG (usually 0.5–1.5 lower).
- Ignoring maintenance reserve — industry norm is $0.18–$0.22/mi.
- Dividing by loaded miles only — you must adjust for deadhead to get true effective CPM.
- Forgetting one-off costs like DOT physicals, drug consortium, tax prep, and IFTA true-ups.
- Setting CPM once a year — diesel and insurance swings can move it $0.20/mi in 30 days.
Key trucking terms & definitions
▼
Every metric in the calculator above maps directly to practical freight terminology used daily by working owner-operators and dispatchers.
The operating cost of running one mile with your truck, calculated as total monthly operating expenses divided by miles run.
Miles driven empty between loads carrying zero revenue, which inflates your effective cost per loaded mile.
Operating expenses that bill whether the truck moves or not (truck note, trailer payment, insurance, IRP, ELD, health).
Expenses that scale directly with miles run (fuel, maintenance reserve, tolls, driver pay per mile, dispatch and factoring fees).
What your dispatcher charges, taken as a percentage of the load's gross pay (typically 5% to 7%).
Fee charged by a factoring company to advance invoice payment early (typically 2% to 3% of gross).
An additional reimbursement or rate adjustment added to the linehaul rate to offset diesel price spikes.
What the broker or shipper pays you per mile to haul freight (linehaul plus fuel surcharge, divided by miles).
Rate per mile minus cost per mile. A minimum of $0.40/mi net is the industry floor, with $0.55–$0.75/mi a healthy solo owner-operator target.
Frequently asked questions
What is cost per mile in trucking?
Cost per mile (CPM) is your total monthly operating expenses divided by the miles your truck ran. It converts a P&L into a single number you can hold up against any load: rate below your CPM loses money, rate above it clears margin. In 2026, healthy U.S. owner-operator CPM lands between $1.85 and $2.10 all-in.
How do you calculate cost per mile for a truck?
Add every monthly cost (truck payment, insurance, fuel, maintenance reserve, driver pay, dispatch, factoring, permits, ELD, personal draw) and divide by paid miles. Then divide again by (1 − deadhead %) to get your true cost against loaded miles only. Recalculate monthly — diesel and insurance swings of $0.10/mi flip which loads are profitable.
What is a good cost per mile for owner-operators in 2026?
$1.85 – $2.10 all-in is the healthy solo owner-operator range in 2026. Reefer runs $2.00 – $2.25, flatbed $1.95 – $2.20, and tanker $2.10 – $2.40 because of heavier equipment cost, insurance, and specialty maintenance. Team operations and small fleets typically shave $0.15 – $0.25/mi by sharing fixed costs.
What is the difference between cost per mile and rate per mile?
Cost per mile is what it costs you to move the truck. Rate per mile is what the broker pays you (linehaul + fuel surcharge, divided by miles). Profit per mile is rate − cost. If your rate per mile isn't at least CPM + $0.40, you are subsidizing the broker.
How do fixed and variable costs affect cost per mile?
Fixed costs (truck payment, insurance, IRP, ELD) don't change with miles, so the more miles you run, the lower your per-mile fixed cost. Variable costs (fuel, maintenance, tolls, dispatch %) scale with miles. That's why parked trucks and heavy deadhead destroy margin — the fixed bucket still bills but no revenue is coming in.
How does fuel price affect cost per mile?
Fuel CPM = diesel price ÷ MPG. At $3.85/gal and 6.5 MPG, fuel alone is $0.59/mi. A $0.30/gal diesel spike at 6.5 MPG adds $0.046/mi — about $4,140/yr on 90,000 miles. Fuel surcharge should offset this; if your FSC lags spot diesel, you're absorbing the difference.
What is a good profit per mile after expenses?
$0.40/mi net is the industry floor. $0.55 – $0.75/mi is a healthy solo owner-operator target in 2026. $1.00+/mi comes from specialty freight (heavy-haul, tanker chem, hazmat), long-term direct-shipper contracts, or extremely lean operations.
How do deadhead or empty miles affect cost per mile?
Deadhead miles carry your full fixed cost with zero revenue. 12% deadhead effectively adds ~$0.25/mi to your loaded CPM. Top dispatched fleets keep deadhead under 8%; a good dispatcher books your reload before you deliver, cutting empty miles 30–50%.
Does cost per mile differ by truck type (reefer vs dry van vs flatbed)?
Yes. Dry van is cheapest at $1.85 – $2.05/mi. Reefer runs $2.00 – $2.25 because of reefer fuel and specialty maintenance. Flatbed is $1.95 – $2.20 (tarps, straps, permit loads). Tanker sits highest at $2.10 – $2.40 from insurance premiums and cleaning costs. Pick the preset on the calculator above to model your equipment.
How often should I recalculate my cost per mile?
Monthly. Diesel, insurance renewals, and maintenance events can shift CPM by $0.10 – $0.20 in 30 days — enough to turn profitable lanes into losers. Rebuild the number at month-end when you close your P&L.
Can this calculator be used for company drivers or is it owner-operator only?
Both. Company drivers can zero out truck/trailer payment, insurance, permits, and dispatch, then enter CPM as (fuel + pay + benefits) to see what their seat costs the carrier — useful before negotiating cents-per-mile pay increases. Owner-operators fill every field.
Where does the 2026 benchmark data come from?
ATRI's 2024 Operational Costs of Trucking report (average marginal cost $2.270/mile), the DAT/FreightWaves 2025 owner-operator surveys, and ATBS 2024 benchmark data — projected forward with current 2026 diesel and insurance conditions. We refresh these figures every quarter.
Related tools
Cost per mile by state (2026)
State-specific CPM benchmarks with local diesel, fuel tax, and lane data for the 10 highest-volume trucking states.
Last reviewed July 10, 2026 by the Bonafide Trucking Solutions LLC dispatch team. Benchmark data refreshed quarterly from ATRI, DAT, and ATBS reports.