
Texas Freight Market Report: August 2026
Market snapshot: August 18, 2026
The latest available truckload data points to stronger U.S. spot-rate conditions alongside comparatively modest freight-volume growth. DAT reported that in June 2026, truckload rates increased faster than volumes, indicating that tighter truck capacity was an important factor behind the rate movement rather than a broad surge in freight demand.
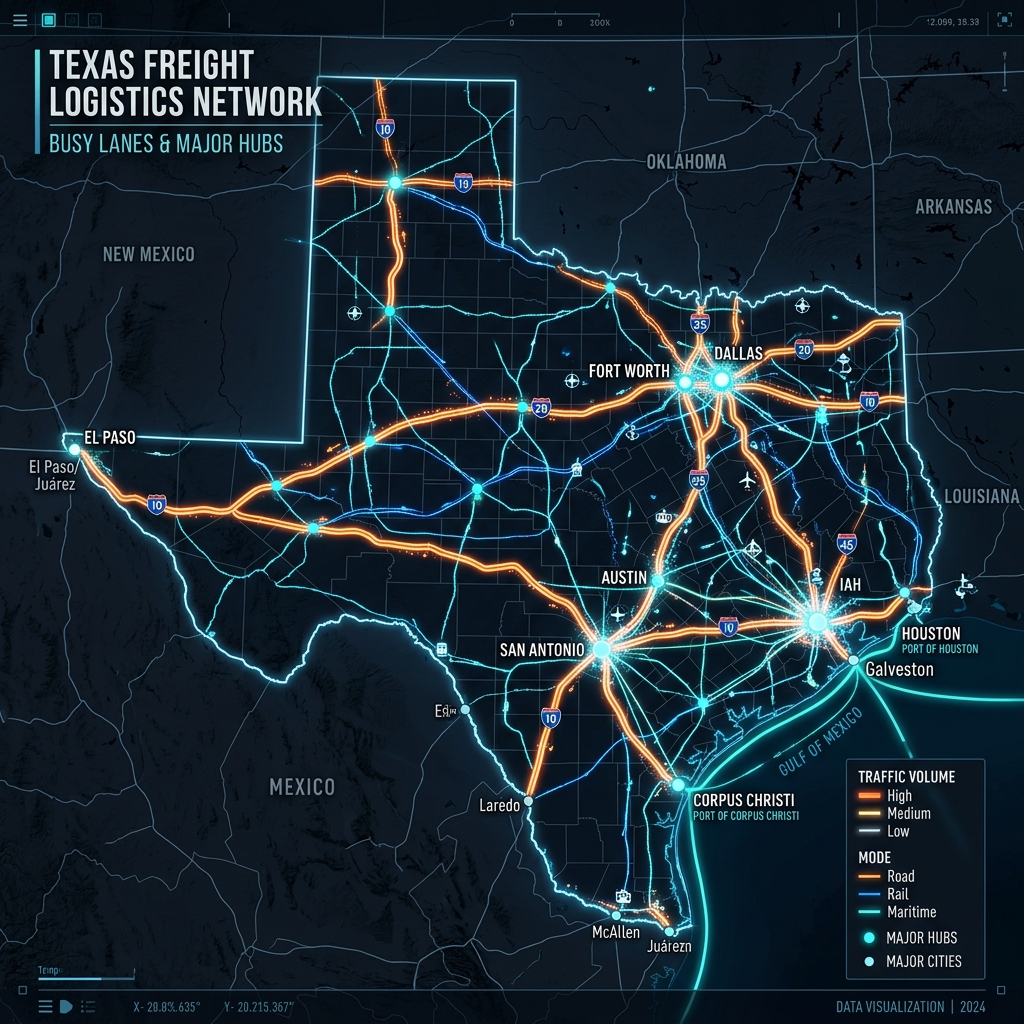
Texas adds another layer to that picture. Its freight market is shaped by major interstate corridors, energy and manufacturing activity, Gulf Coast ports, international trade with Mexico, rail and intermodal facilities, and large distribution markets. For a carrier, the practical lesson is that a strong headline market does not make every Texas load attractive. Origin, destination, equipment, deadhead, timing, and the next available load still matter. If you want to coordinate these market conditions with a professional team, you can learn about Bonafide's best dispatch service in Texas.
Request Market Insights
Leverage our logistics intelligence to optimize your route lanes.
What the Texas Freight Market Looks Like Right Now
There is an important distinction between Texas-specific freight fundamentals and national truckload market indicators. Texas-specific government data is strong for understanding freight infrastructure, commodities, trade gateways, and transportation flows. Current national truckload data is stronger for measuring spot-rate and capacity conditions.
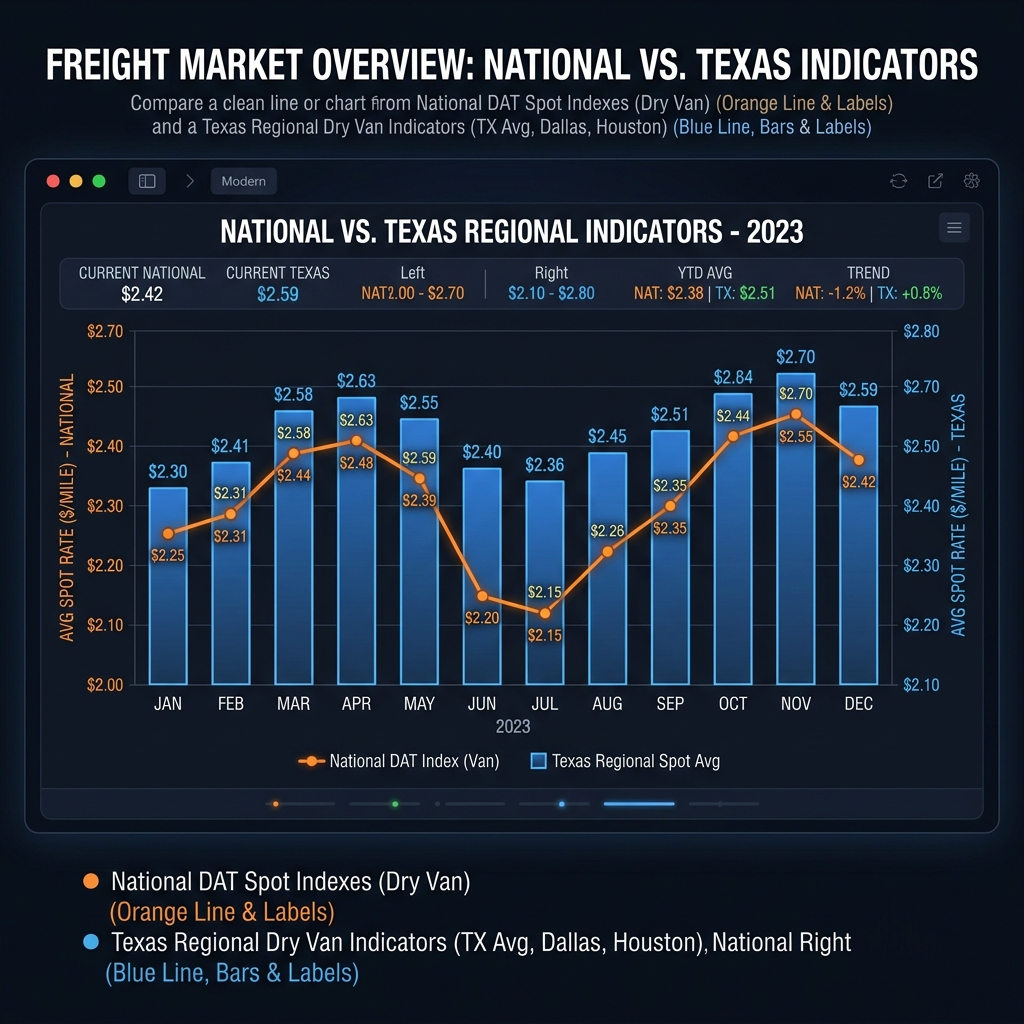
The latest DAT report available for this snapshot covers June 2026:
| Equipment | June 2026 volume index | Change from May | Change from June 2025 |
|---|---|---|---|
| Van | 262 | +11% | Roughly flat |
| Reefer | 184 | +5% | -8% |
| Flatbed | 308 | +12% | -4% |
DAT also reported that the national average van spot rate exceeded the contract rate in June for the first time since February 2022. Spot linehaul rates increased at least 39% year over year across van, reefer and flatbed, while volumes were flat to lower. Rates rising faster than volumes does not necessarily mean freight demand suddenly became much stronger. DAT specifically attributed the divergence to tighter truck capacity.
These figures are national, not Texas-specific. A Texas carrier should use them as market context rather than assume the same percentage movement applies to an individual Texas lane.
Dry Van, Reefer and Flatbed Conditions
Dry van
Van volumes increased from May to June 2026 and were roughly flat year over year, according to DAT. At the same time, national spot rates strengthened substantially. For a Texas dry-van carrier, that means the national market may be providing a more supportive rate environment than the weak freight cycle of earlier periods. It does not mean every Texas origin has the same pricing power.
- • Deadhead to pickup
- • Total trip miles
- • Delivery market reloads
- • Appointment times & home-time plans
Reefer
Reefer volume increased 5% from May to June but remained 8% below June 2025 nationally. That makes equipment-specific analysis important. A reefer operator should not assume that stronger spot pricing means uniformly stronger refrigerated demand. Produce, food and other temperature-controlled freight can also create regional and seasonal differences.
Flatbed
Flatbed had the largest June month-over-month volume increase among the three equipment categories in DAT's index, rising 12% from May. DAT also reported that flatbed spot rates reached a record high in June. For Texas carriers, this is relevant because the state's energy, manufacturing and construction-related activity creates substantial potential demand for equipment capable of moving industrial and project freight.
Texas's Major Freight Corridors
Texas has a multimodal freight network rather than one dominant trucking route. TxDOT describes the Texas Highway Freight Network as connecting urban and rural areas through highways, railroads, ports, waterways, airports and pipelines.
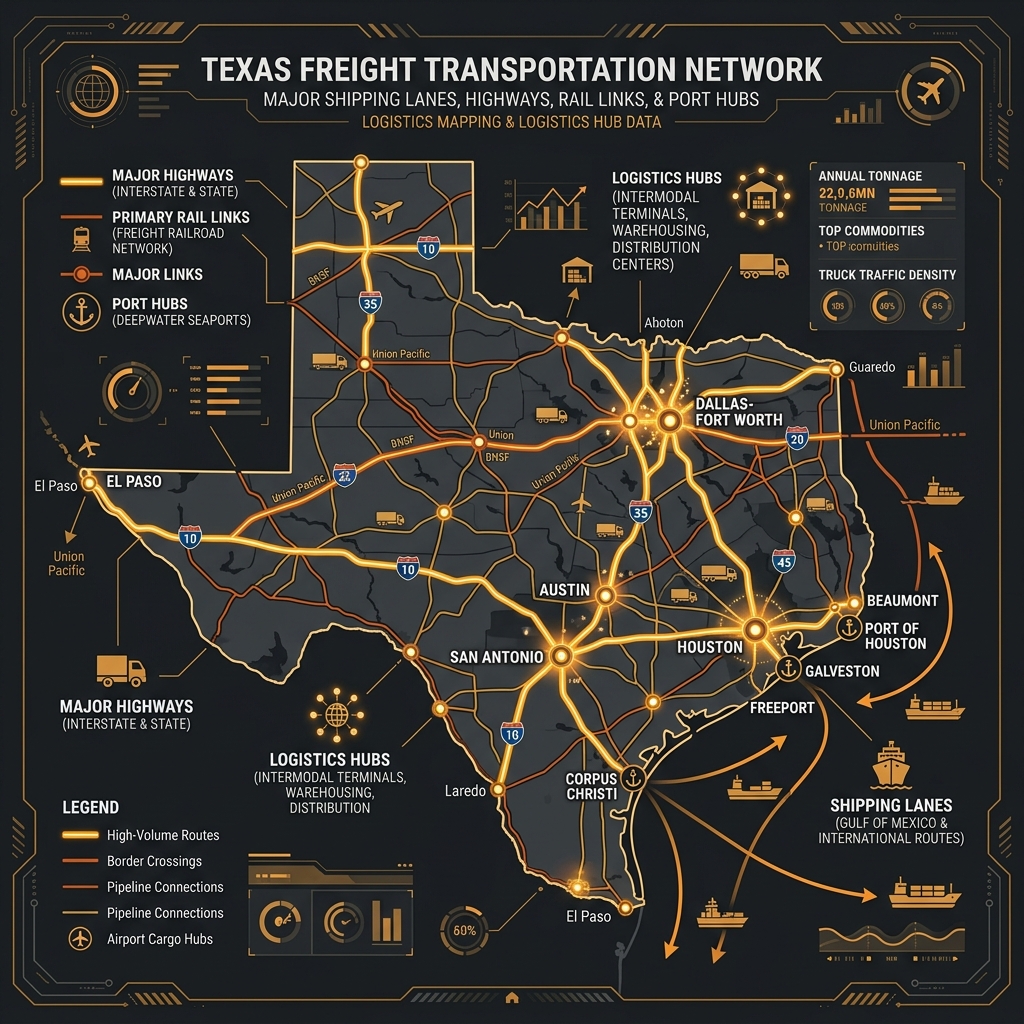
• I-10: Major east-west corridor connecting major Texas markets and Southern freight networks. Evaluate origin, exit, delivery windows, empty miles, and reload prospects.
• I-35: Major corridor for north-south freight and international trade. TxDOT's Texas Connected Freight Corridors project includes the I-35 extension to Laredo, giving carriers a major artery for repositioning and reloads.
• I-45: Connects the DFW and Houston areas through the central part of the state, serving major population and industrial markets.
• I-20 and I-69: I-20 provides east-west connections across North and East Texas. I-69 is strategically important for international trade infrastructure. A route is valuable because of the freight markets it connects, not simply because it is a major highway.
Where Texas Freight Comes From
Energy and industrial freight: Texas produced 1.728 billion barrels of crude oil in 2024 according to Texas Comptroller data. Energy activity creates freight requirements throughout associated industrial supply chains, including equipment, machinery, chemicals, petroleum products and other materials.
Manufacturing: Texas has major manufacturing activity across sectors including chemicals, petroleum and coal products, electronics, vehicles, machinery, aerospace, fabricated products, and food. This diversity creates a broad mix of freight.
Agriculture and food: Agricultural and food freight is another important component of the Texas transportation system, especially relevant to reefer operators. Monitor seasonal shifts across regional sectors.
Ports, Border Trade and Intermodal Freight
Texas ports of entry accounted for more than $1 trillion in international trade in 2024, spanning 32 seaports, airports, and land ports.
Port Houston
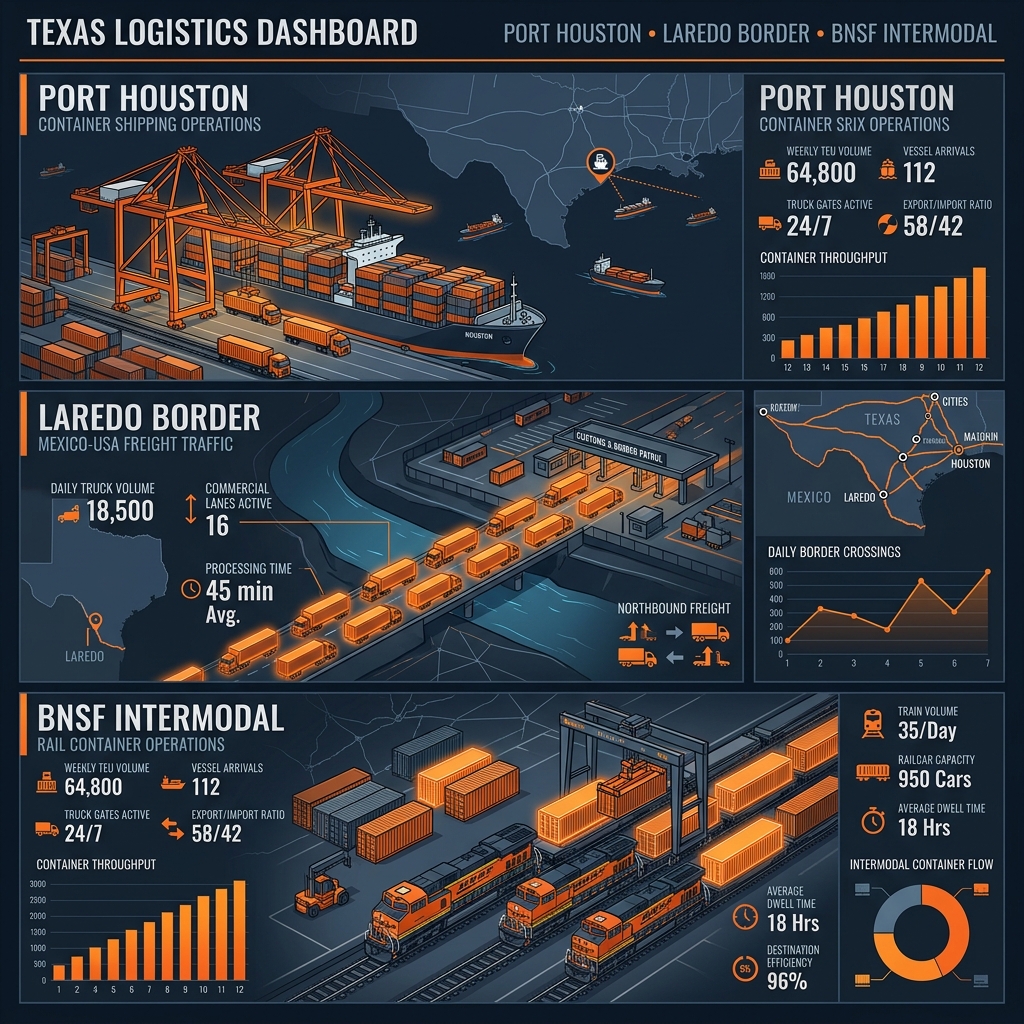
According to the Texas Comptroller's 2024 analysis, $223.5 billion in trade moved through Port Houston in 2024 (52% of Texas seaport trade by value). Key commodities include mineral fuels, organic chemicals, plastics, machinery, vehicles, and iron and steel. Evaluate pickup timing, equipment, rates, and reload options when serving the port.
Laredo and Mexico trade
Texas has multiple land ports connecting its trucking network with Mexico. Its rail network also connects with Mexican gateways including Brownsville, Laredo, Eagle Pass and El Paso. Laredo is highly relevant to south Texas positioning, but the border destination should always be evaluated against reload positioning to protect profit margins.
Rail and intermodal
Texas has 10,370 rail miles served by BNSF, CPKC, and Union Pacific. Intermodal facilities like AllianceTexas connect rail container shipping from major seaports to regional distribution hubs, creating drayage, transload, and downstream truckload demands.
Major Texas Freight Megaregions
The core distribution hubs serve as the center of megaregional logistics:
Seasonality: What Can Change During the Year?
Texas freight lanes vary by season and project cycles:
• Reefer & Agricultural shifts: Seasonal produce movements change temperature-controlled freight demands locally.
• Retail inventory cycles: High volume moving toward regional distribution networks ahead of holiday seasons.
• Industrial and energy projects: Flatbed demands fluctuate around regional construction and drilling cycles.
• Gulf Coast weather risks: Severe summer and fall storms can disrupt highway, port, and industrial terminal logistics.
What Current Market Conditions Mean for Texas Carriers
1. Do not treat a national rate increase as a Texas lane guarantee: Local capacity conditions still dictate actual spot market rates.
2. Compare the complete trip: Factor in deadhead, tolls, fuel, and next-load repositioning costs.
3. Be careful about deadheading into hot markets: Make sure the outbound reload rate justifies the empty positioning miles.
4. Think about the reload before booking: DAT introduced reload recommendations in 2026, highlighting the need to check outbound freight before locking in the inbound delivery.
5. Match the market to the equipment: Reefer and flatbed trends diverge from dry van. Keep specialized equipment focused on matching lanes.
Texas Freight Market Outlook
The current picture shows national spot rates strengthening through June 2026 on tight capacity, with volumes flat or below the prior year. Texas continues to invest in freight mobility and is developing its 2027 Texas Freight Mobility Plan.
TxDOT's 2027 Texas Freight Mobility Plan is currently in development, with freight bottleneck and network assessments underway in 2026. Rather than assuming today's rates will continue, carriers should monitor local equipment demand, deadhead, reloads, port activity, and seasonal freight cycles.
Evidence limitation: The latest public DAT data used here is national. No verified public source established a single August 18, 2026 Texas-wide spot rate, load-to-truck ratio, or tender-rejection rate.
Coordinate Your Routes With Logistics Experts
Evaluating the market, broker communication, and load searching is a complex daily workload.
To see how daily market conditions translate into dispatch decisions, read our Texas Owner-Operator Dispatch Guide. If you would like to delegate load coordination and negotiations, you can evaluate Bonafide's truck dispatch support for Texas carriers.
Frequently Asked Questions
Is the Texas freight market strong right now?
The latest available DAT data for June 2026 showed stronger national spot-rate conditions, with rates increasing faster than truckload volumes. DAT attributed the divergence primarily to tighter capacity. This does not establish that every Texas lane is strong.
Are truckload rates rising or falling in Texas?
There is no single reliable public statewide rate that represents every Texas truckload lane. The latest DAT data shows national spot-rate strength through June 2026, but Texas carriers should evaluate actual lane-level offers.
What are the biggest freight corridors in Texas?
Important corridors include I-10, I-35, I-45, I-20 and I-69, alongside other state and U.S. routes. TxDOT's Connected Freight Corridors project specifically focuses on I-35, I-45 and I-10.
Which industries generate freight in Texas?
Major freight-generating sectors include energy, manufacturing, agriculture and food, distribution, international trade and port-related activity.
How should Texas carriers use freight-market conditions when choosing loads?
Use market information as context rather than as a substitute for evaluating an individual load. Compare the rate, loaded miles, deadhead, appointment schedule, equipment requirements, destination and reload potential.